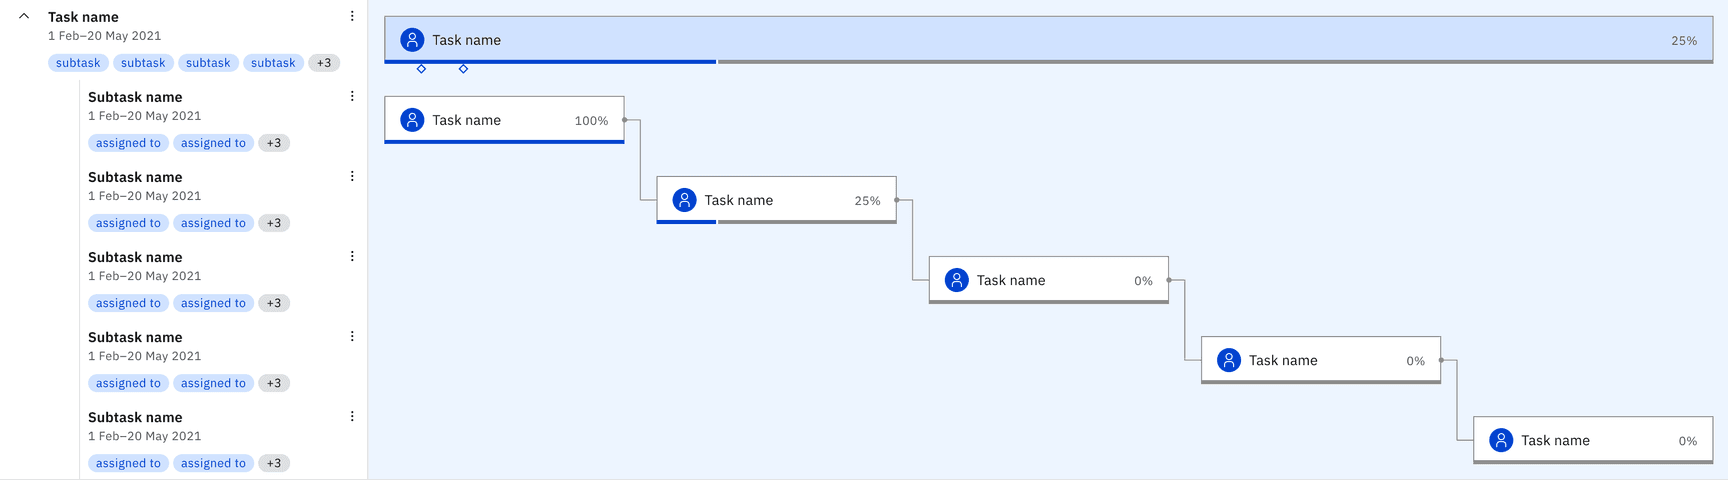
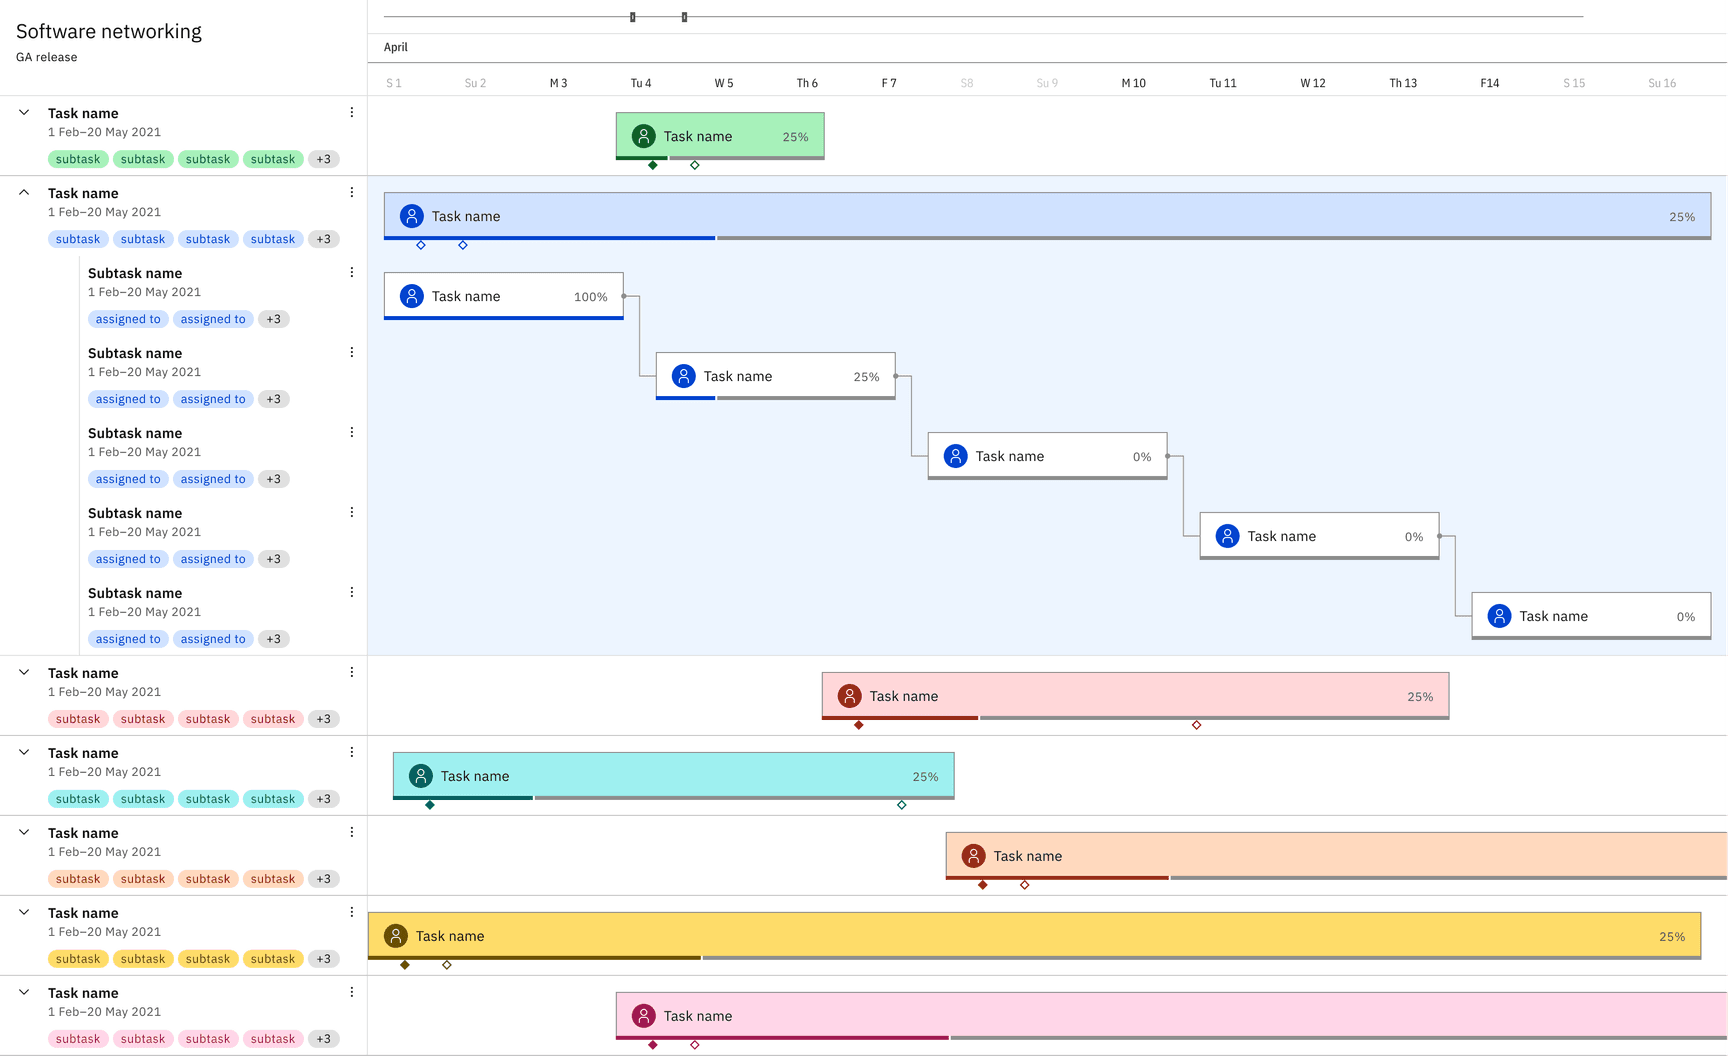
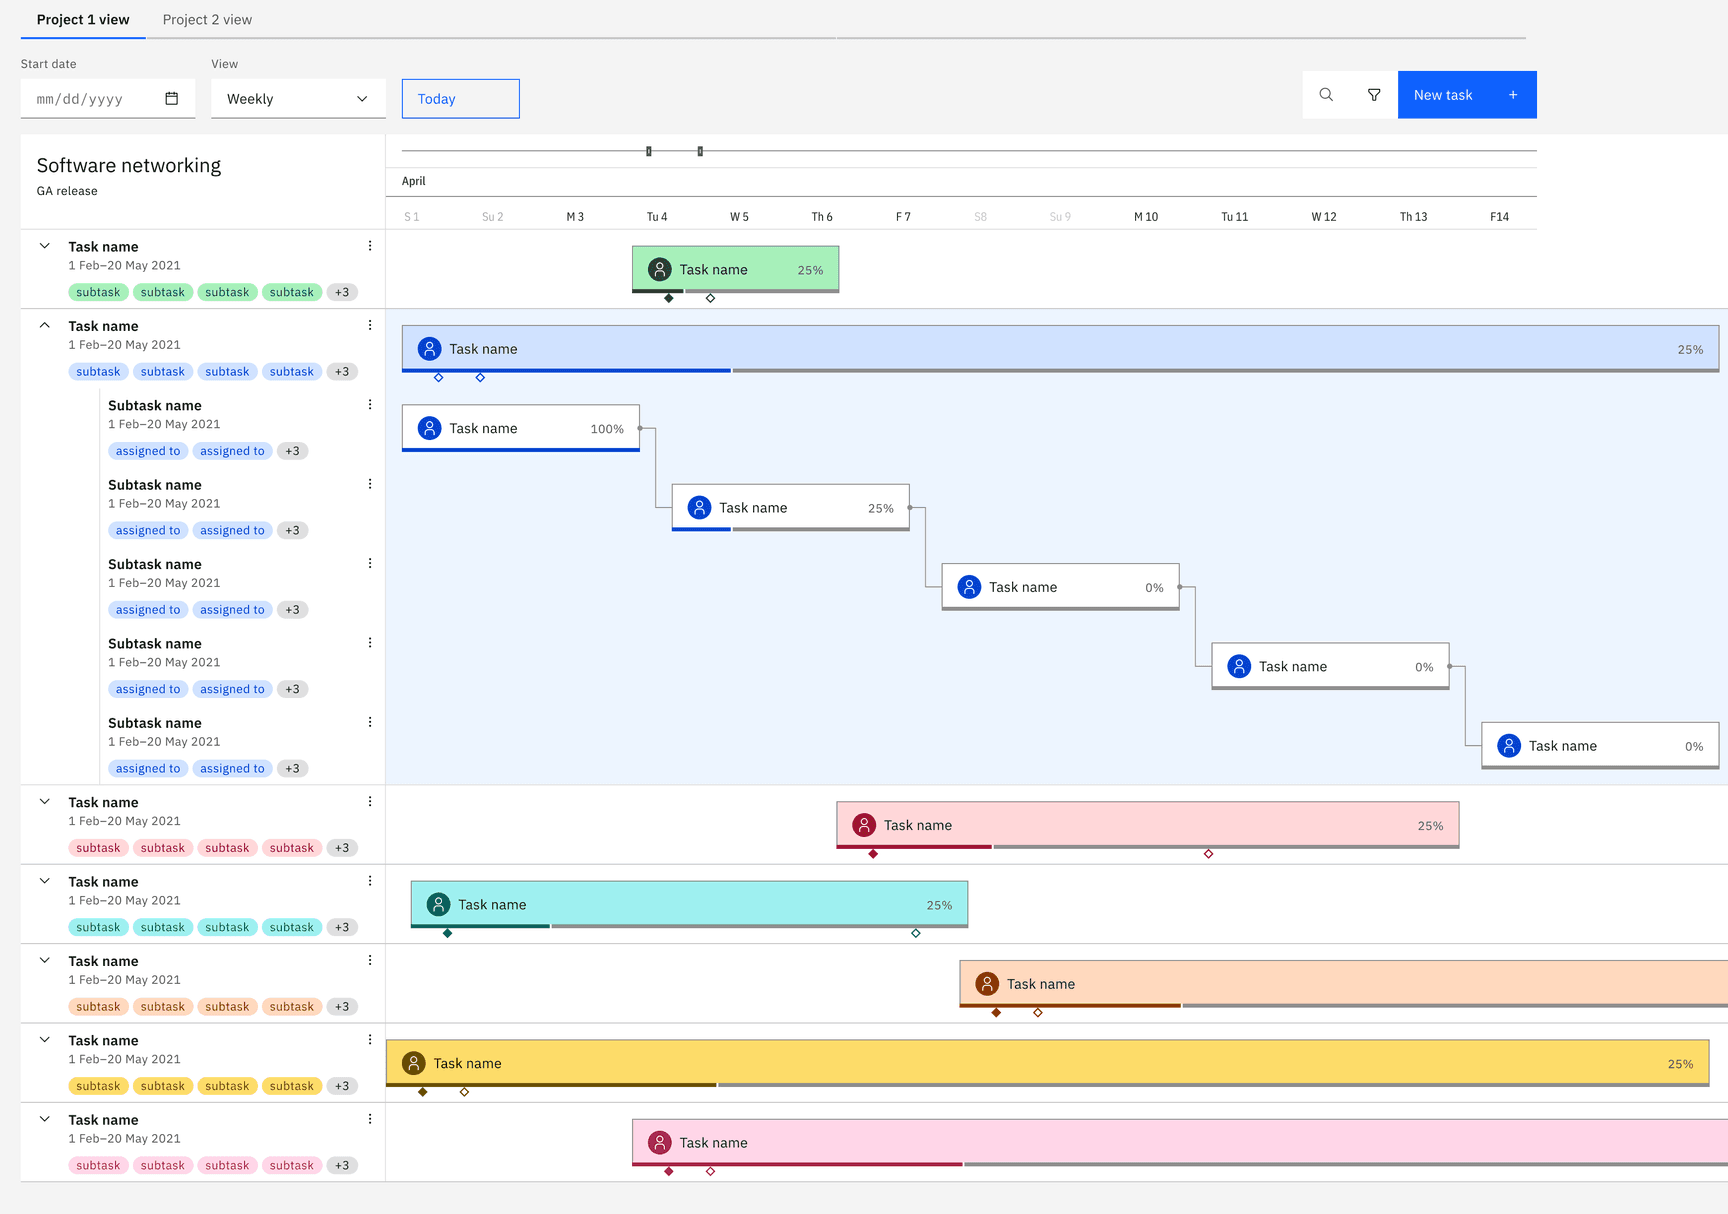
A Gantt chart is a project management tool that illustrates work completed over a period of time in relation to the time planned for the work. It typically includes two sections: the left side outlines a list of tasks, while the right side has a timeline with schedule bars that visualize work.