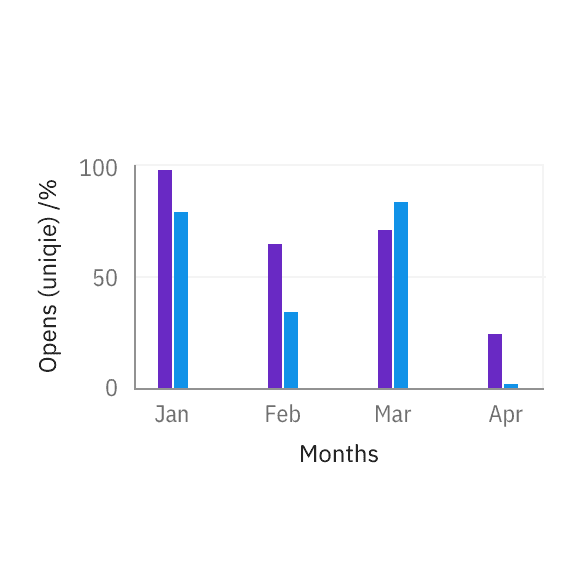
For bar charts, the numerical axis should start at zero.
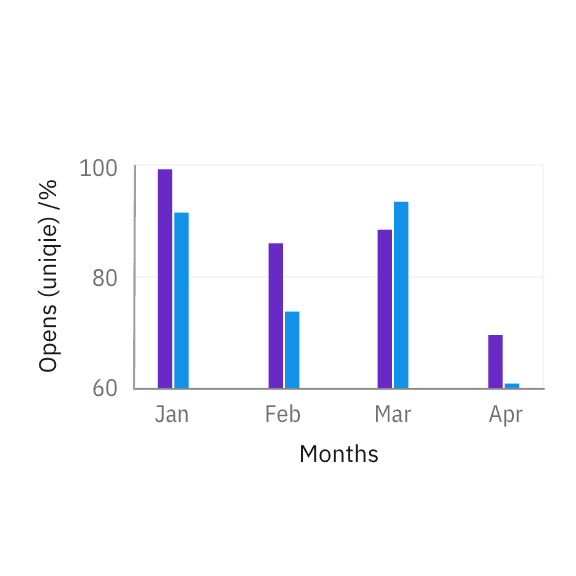
When an axis starts at non-zero, percentage differences between bars are exaggerated.
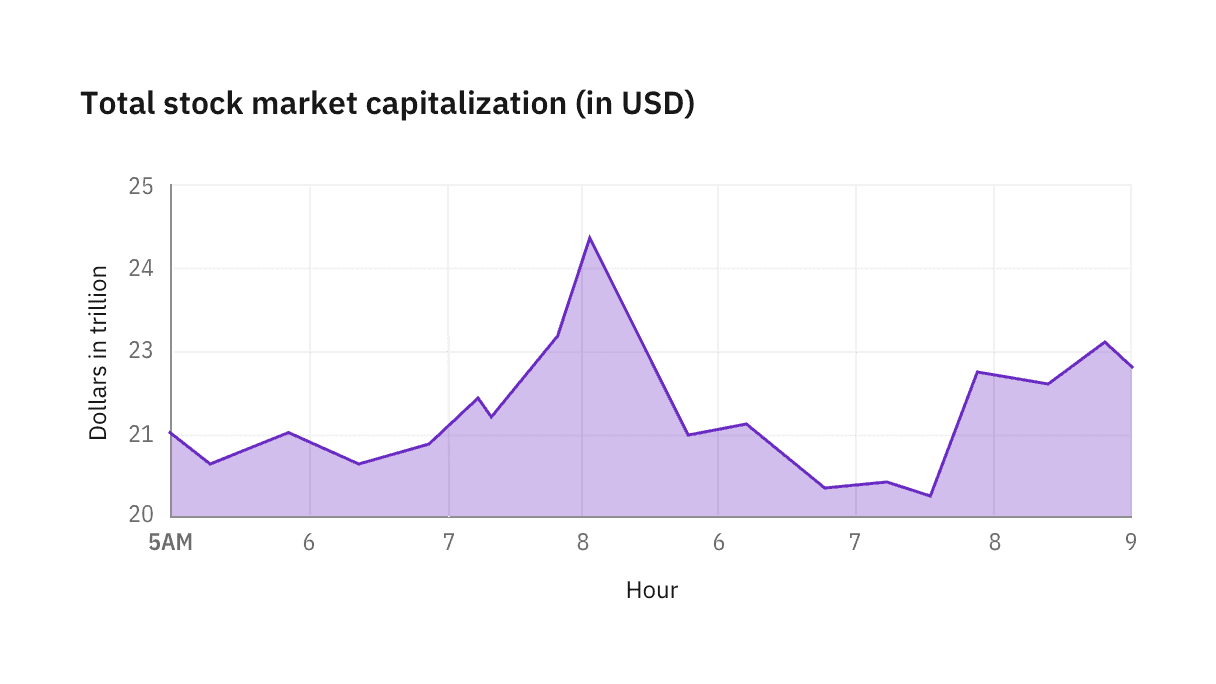
For line charts showing stock market activities, the existence of peaks and valleys in trends is more important than the true size of the change.
Breaks in axes
Sometimes it is useful to skip part of the axis to bring data on the extreme ends into view without distortion. When the axis contains a break, use a sinusoidal line to replace the straight axis line.
On the X axis, the break can be fluid with graph area size, with a minimum width of 16px. On the Y axis, we recommend using a fixed distance of 16px for the break.
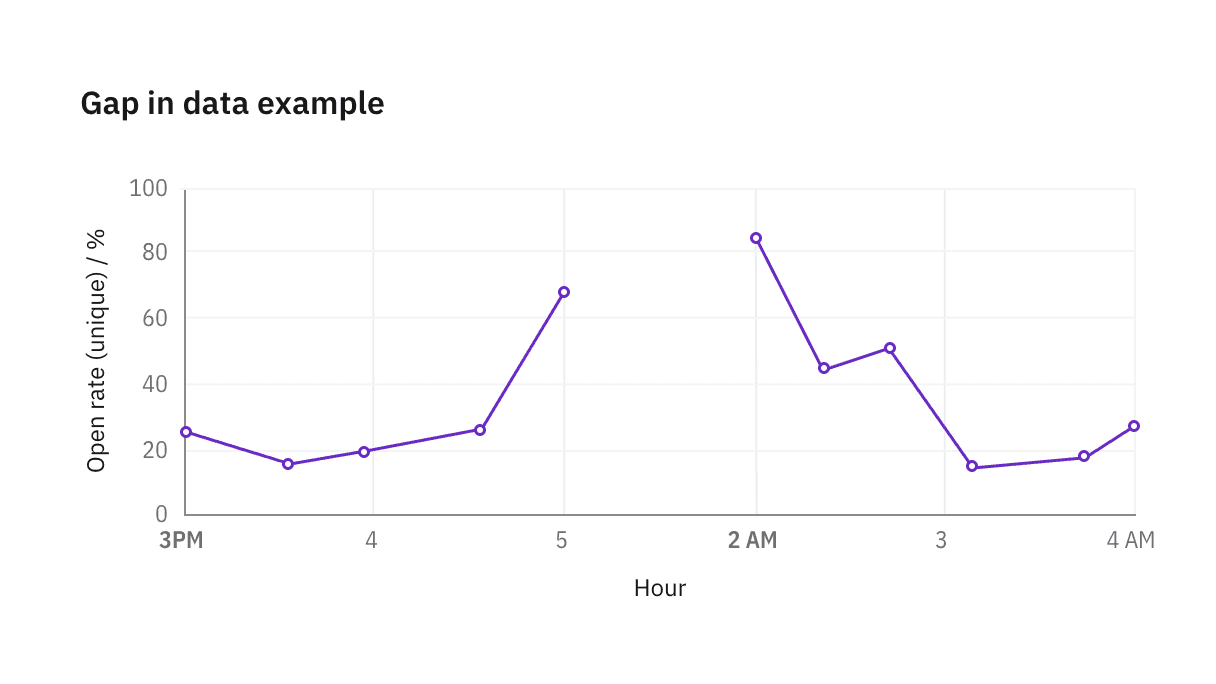
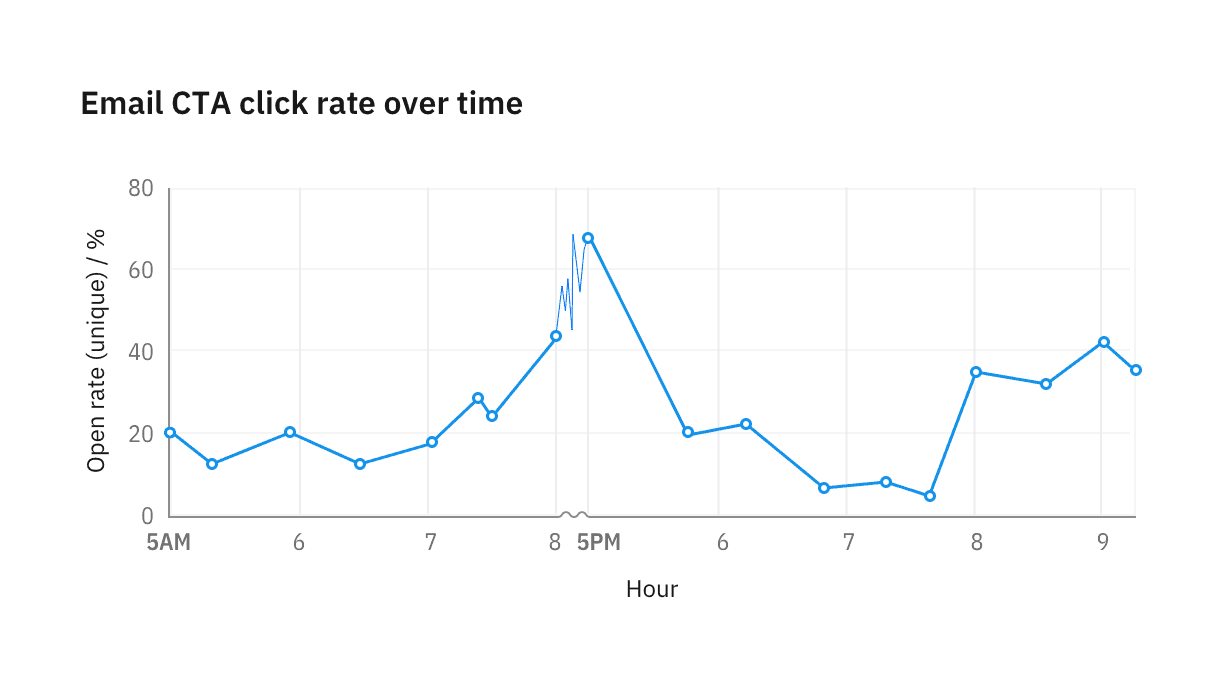
If data is available during an axis break, re-style line segments to use 0.5px stroke and hide circles representing data points.
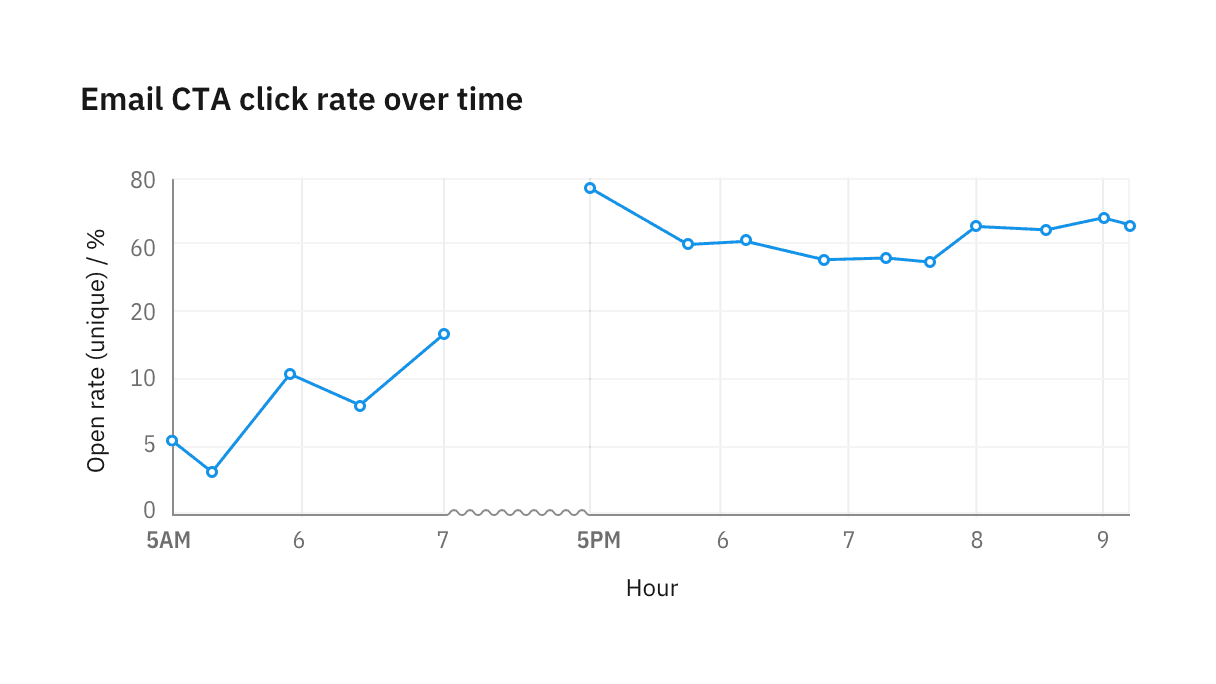
If data isn’t available between axis breakpoints, leave the area empty.
Consistent increments
Never change axis ticks increments to accommodate data availability. If any form of axis compression is required, use the provided axis break styling to visually denote the compression.
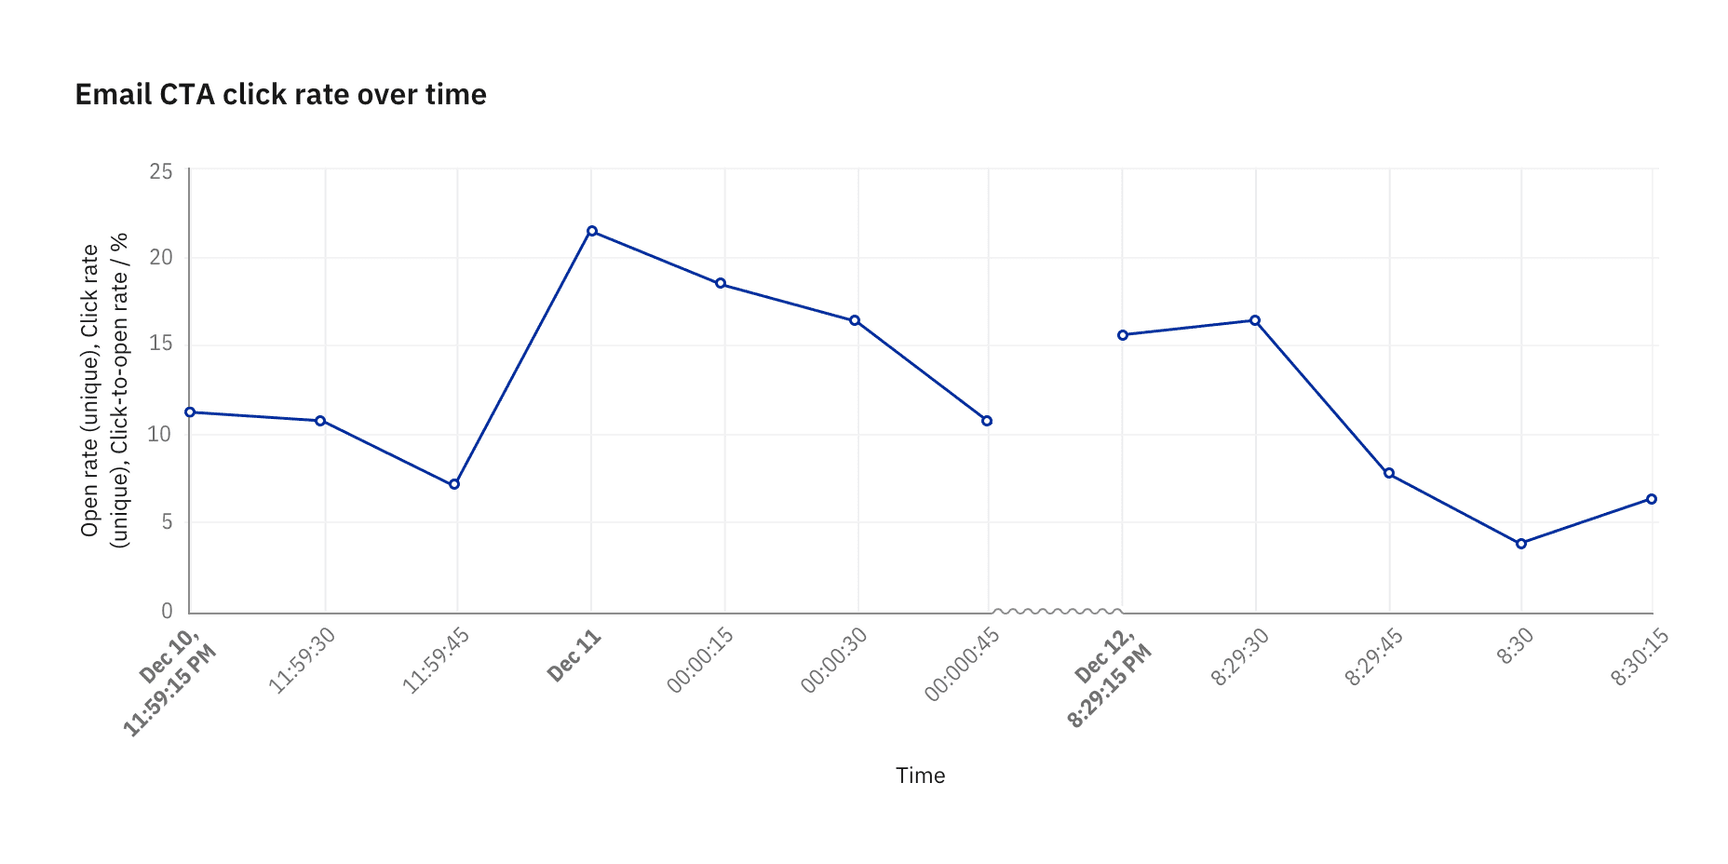
Example of a time series plotted at 15 seconds intervals